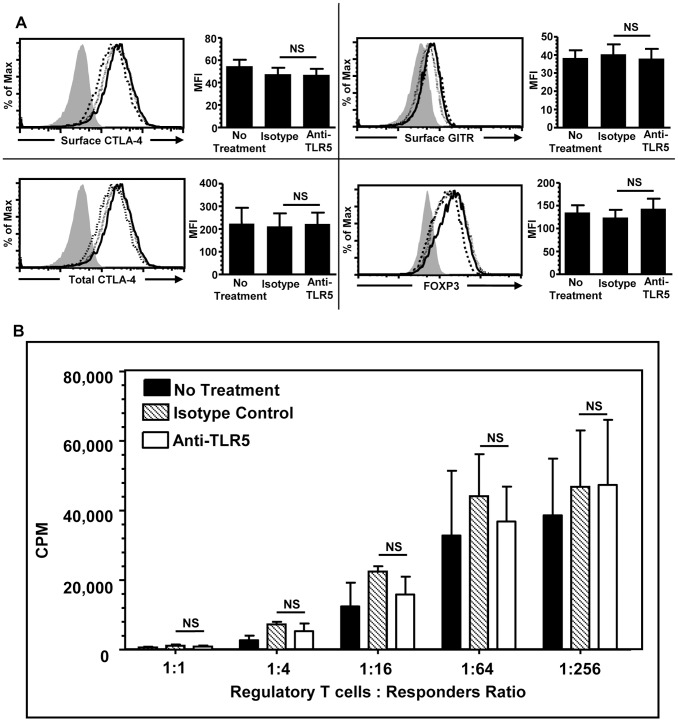
Figure 4. TLR5-related signals did not affect the function of CD4hiCD25+ regulatory T cells.
(A). Flow cytometric and statistical analysis of the expression of surface CTLA-4 (upper left panel), intracellular CTLA-4 (lower left panel), surface GITR (upper right panel), and FOXP3 (lower right panel) of CD4hiCD25+ regulatory T cells generated with no treatment (dotted line), with isotype-matched mAb (dashed line), and with anti-TLR5 blocking mAb (solid line) after 6 days of co-culture of naïve CD4+CD25−CD45RO− T cells and allogeneic CD40-activated B cells and filled histogram indicates staining obtained from the isotype-matched mAb for staining antibodies. Data were shown in Mean+SEM, n = 6. (B) 3H-thymidine incorporation of CD4hiCD25+ regulatory T cells in suppressive MLR at different regulatory T cells: responsders ratio. Data show Mean+SEM, n = 6. All data shown are from 3 independent experiments. NS, not significant, one way ANOVA with Tukey’s pairwise comparisons.

