
Figure 4. Effect of different pCO2 (µatm) levels on metabolism of Concholepas concholepas.
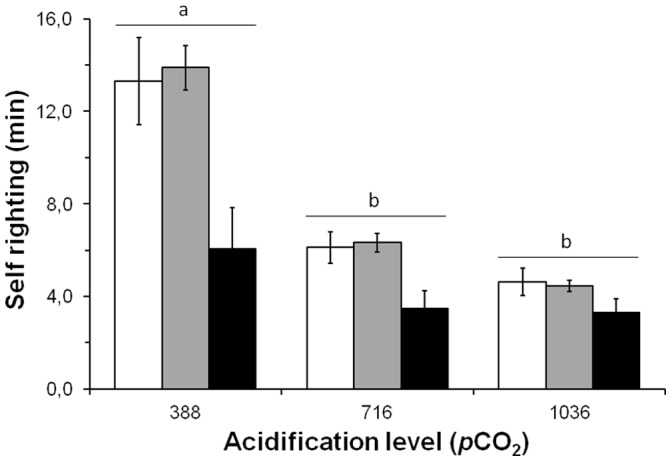
Mean (± SE) metabolic rate after 100 days of exposure to differing levels of pCO2. The individuals (n = 10) were reared in the three contrasting pCO2 levels and then assigned sequentially to each one of the experimental condition with and without predation risk. Self-righting values that do not differ at 0.05 level in Tukey tests, following a General Lineal Model, are indicated by a line above the bars. See details in the result sections.