
Figure 3.
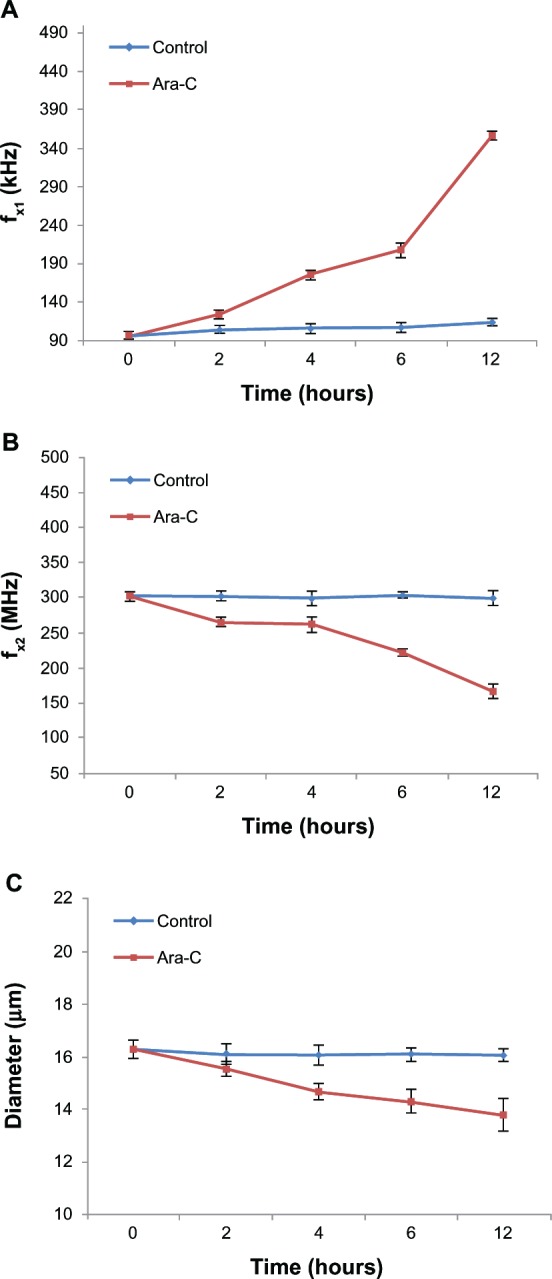
Monitoring of Ara-C induced apoptosis by DEP analysis. (A and B) Distinct differences in crossover frequency occur between control and the apoptotic NB4 cells as early as 2 h post-exposure to Ara-C. ƒx1 increased from 96 ± 4.73 to 354 ± 6.11 KHz, while ƒx2 decreased from 301 ± 7.09 to 165 ± 7.78 MHz over the 12-h time course. (C) Cell diameter decreased from 16.30 ± 0.35 to 13.81 ± 0.62 μm in apoptotic cells.
Note: No significant change was observed for control cells.
Abbreviations: Ara-C, cytosine arabinoside; DEP, dielectrophoresis.