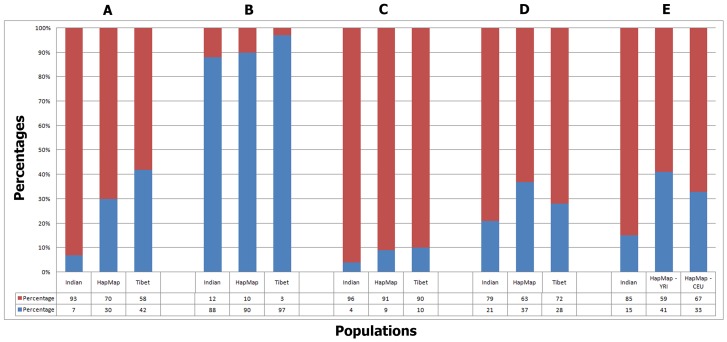
Figure 1. The first, second and third bars in groups A–D represent Indian, HapMap and Tibetan populations.
Group A denotes percent of subjects with OR genes with CNVs (Red) over subjects without OR genes with CNVs (Blue). 93% of Indian, 70% of HapMap and 58% of Tibetan populations were found to contain CNVs. Group B denotes the percent of OR genes with CNPs identified in this study (Red) over percent of OR genes not identified in this study (Blue). 12%, 10% and 3% of the total OR genes were found to contain CNPs in Indian, HapMap and Tibetan populations respectively. Group C represents the percent of OR intact genes (Red) over pseudogenes (Blue) with CNPs identified in this study. Indian population showed 4% and 96%, HapMap showed 9% and 91% and Tibet showed 10% and 90% of CNPs in intact and pseudogenes respectively. Group D represents deletions (Red) over duplications (Blue) identified in this study. Indian, HapMap and Tibetan populations showed 21%, 37% and 28% of deletions and 79%, 63% and 72% of duplications respectively. Group E denotes the inherited duplications (Blue 14%) and inherited deletions (Red 1%) whereas stan ds for de novo duplications (58%) and de novo deletions (27%) observed in Indian population whereas, HapMap – YRI trio data denotes 41% and 59% inherited and de novo events the and HapMap – CEU trios shows 33% and 67% inherited and de novo events.

