
Figure 1. Growth profiles of L. lactis at different pH values.
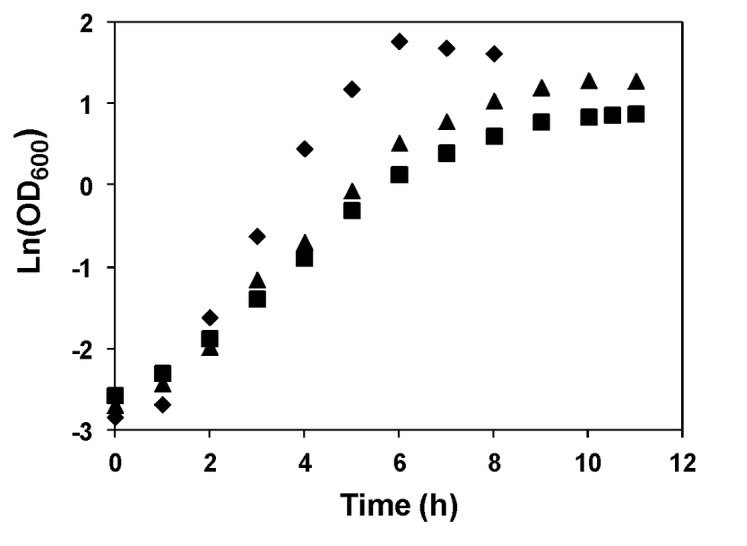
Growth was performed in CDM with 1% glucose (w/v) at 30 °C, with pH controlled at 6.5, 5.1 and 4.8. pH was controlled by addition of 10 M NaOH. Growth rate (μ): pH 6.5, 0.97±0.08 h-1; pH 5.1, 0.63±0.04 h-1; pH 4.8, 0.53±0.01 h-1. Symbols: diamond, pH 6.5; triangle, pH 5.1; square, pH 4.8. Data shown are representative from at least two identical experiments.