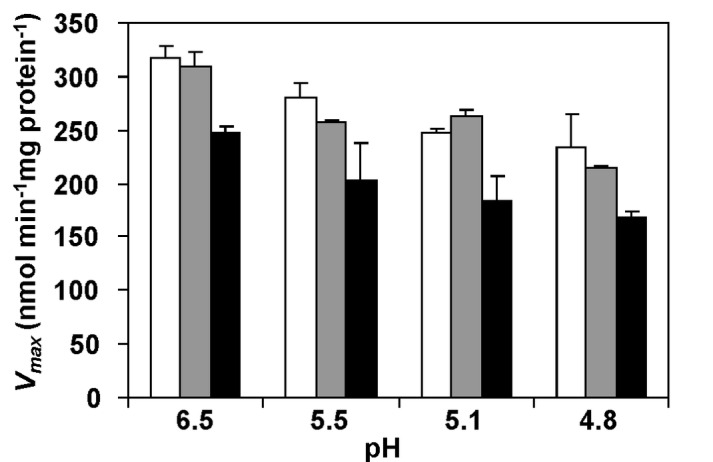
Figure 4. Effect of various conditions on the maximal glucose uptake rate in L. lactis.

Effect of pH alone (white bars), extracellular lactic acid (grey bars) and intra and extracellular lactic acid (black bars) on V max (nmol min-1 mg protein-1) for glucose uptake assessed by [14C] radio-labelled assays with L. lactis cells. Glucose was added to a final concentration of 0.1 mM.
