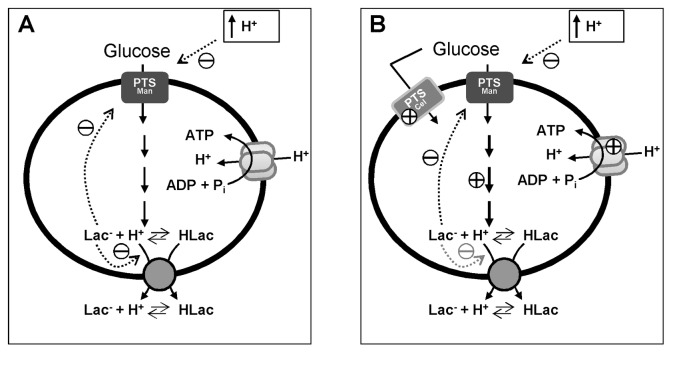
Figure 7. A qualitative model for pH effects and acid stress adaptation of L. lactis cells.
(A) Non-adapted cells (grown at pH 6.5 and suspended in buffer at pH 5.1); and (B) adapted (grown at pH 5.1 and suspended in buffer at pH 5.1). Dotted arrows indicate metabolic effects with the sign indicated; signs without arrows indicate transcriptional effects. Abbrev: HLac, non-dissociated form of lactic acid; Lac-, lactate anion. The adapted and non-adapted energized cells both had the same internal pH of 6.3.

