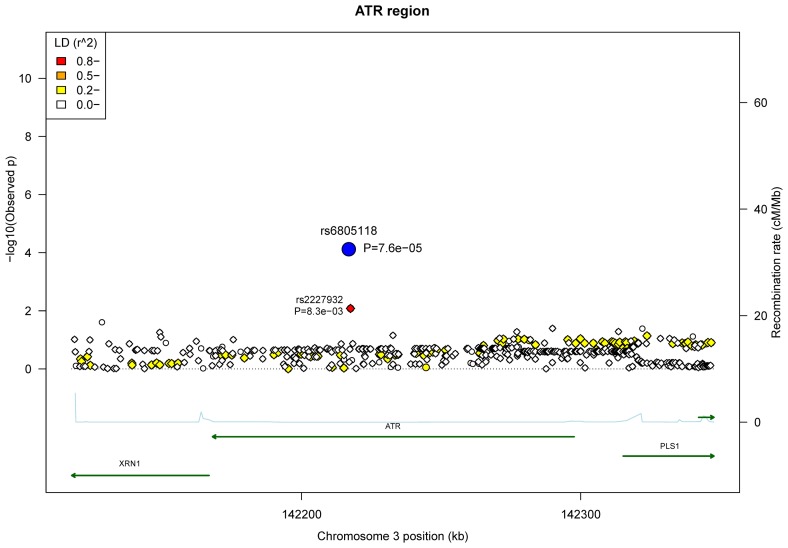
Figure 1. Association plots of the 32 typed SNPs and 454 imputed variants in the ATR region.
The most significant signal (rs6805118, p=7.6x10⁻⁵) is labelled with the large blue circle. Circle symbols stand for the typed SNPs and diamond symbols represent the imputed variants. LD associations (r2) with rs6805118 were calculated in 85 CEU and 89 GBR (integrated call release as of 2010-11-23) in the 1000 genomes project. Gene transcripts are indicated by the dark green lines, with right arrowhead for the “+” strand and left arrowhead for the “-” strand. Recombination rate (blue line) was obtained from HapMap II.

