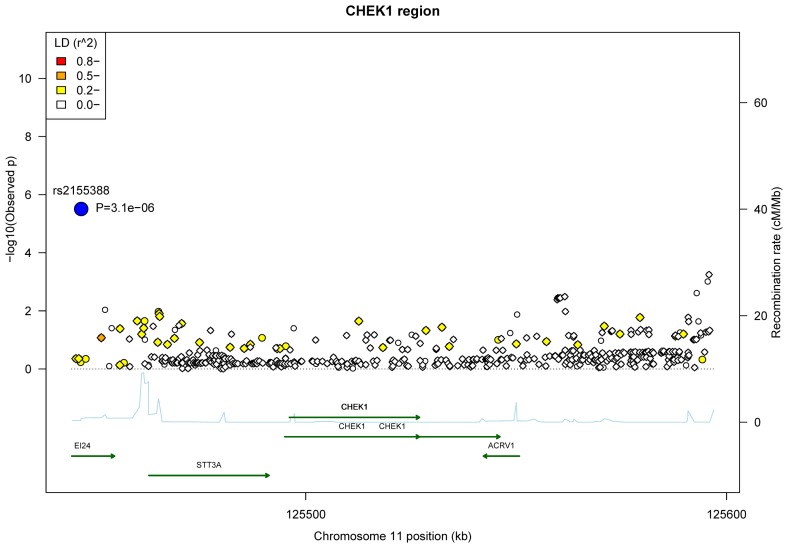
Figure 2. Association plots of the 44 typed SNPs and 434 imputed variants in the CHEK1 region.
The most significant signal (rs2155388, p=3.1x10⁻⁵) is labelled with the large blue circle. The typed SNPs and the imputed variants are shown in the circle and diamond symbols, respectively. Pair-wise r2 with rs2155388 were calculated in 85 CEU and 89 GBR (integrated call release as of 2010-11-23) in the 1000 genomes project. Gene transcripts are indicated by the dark green lines, with right arrowhead for the “+” strand and left arrowhead for the “-” strand. Recombination rate (blue line) was obtained from HapMap II.

