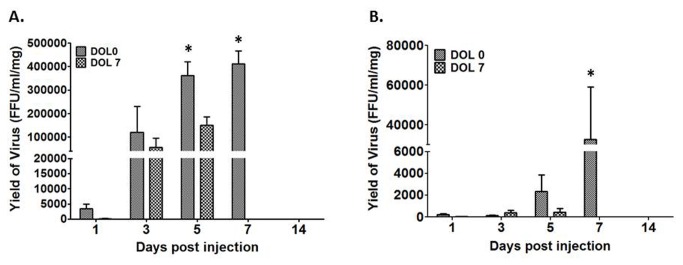
Figure 5. Quantification of infectious RRV post infection.

The two graphs illustrate the quantity of live RRV present in the extrahepatic biliary tree (A) and in the liver (B) 7 days post injection. * p<0.05.

The two graphs illustrate the quantity of live RRV present in the extrahepatic biliary tree (A) and in the liver (B) 7 days post injection. * p<0.05.