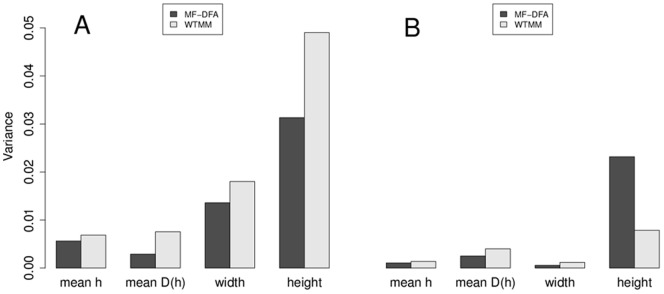
Figure 2. Variance comparison between MF-DFA and WTMM techniques.

A. For 14 subjects with 8 m of waking EEG each, divided into 30 s segments (16 segments of n = 7500 data points each per subject), multifractal spectra were calculated (total of 224 segments). Mean Hölder exponent value (mean_h), width of the Hölder exponents (width_h), mean fractal dimension (mean_D(h)) value, and height of the multifractal singularity spectrum (height_D(h)) were calculated for each segment. B. The 14 subjects’ 8 m of waking EEG were analyzed whole, and multifractal specta were calculated. Note the trend to reduced variance with increasing length of EEG tracing.
