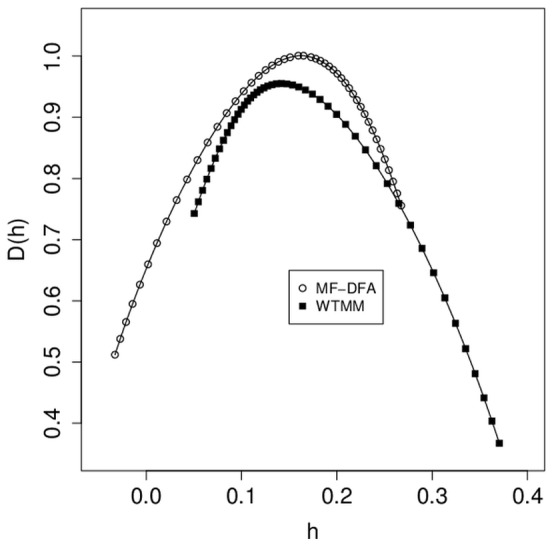
Figure 3. Comparison of waking EEG between MF-DFA and WTMM.

For 14 subjects with 8 m of EEG from waking data per subject, MF-DFA and WTMM spectra were calculated for each 8 m EEG series. Average multifractal spectra for each technique shown here were calculated by averaging individual spectra across subjects: mean_h±s.d. is 0.12±0.03 for MF-DFA, and 0.17±0.04 for WTMM.
