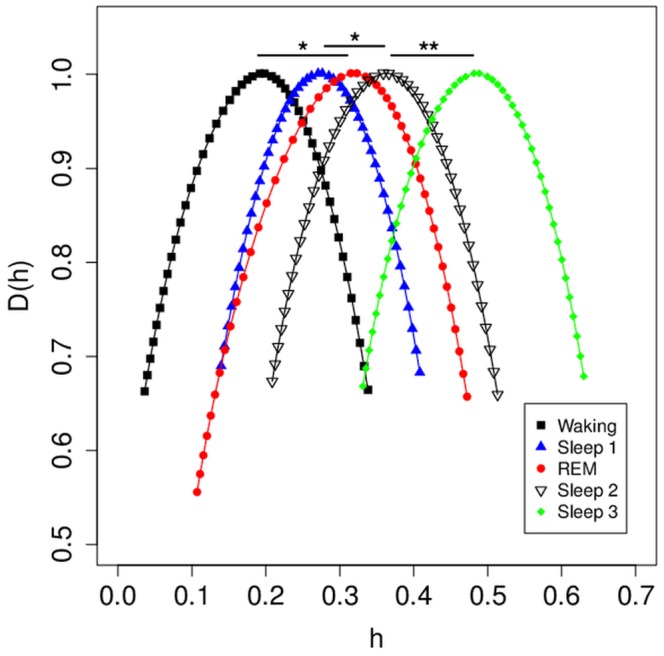
Figure 5. Comparison among stages of sleep for 1 minute of EEG data.

For each stage from each subject, 1 min of EEG data was used to calculate MF-DFA spectra. Average MF-DFA spectra for each consciousness state shown here were calculated by averaging across individual spectrum values for each subject. Mean h values were then calculated for the h range, and differences between sleep stages compared by paired t testing. *p<0.05; **p<0.01. Significant differences were found for the waking-REM, Sleep 1-Sleep 2, and Sleep 2-Sleep 3 comparisons.
