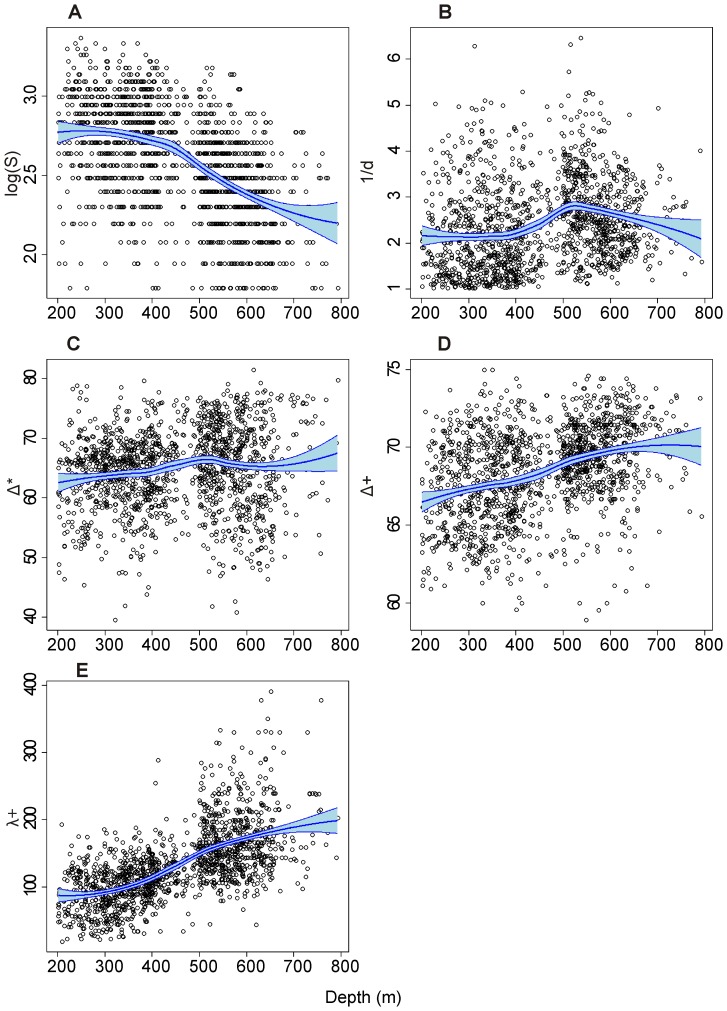
Figure 4. Bathymetric trends in diversity.
Variation of the selected indices (ordonnate) according to depth (abscissa) without neutralisation of the effects of year and biogeographical zones (Loess curves with confidence interval). (A) log S, (B) 1/d, (C) Δ* (D) Δ+, (E) Λ+. Codes of diversity indices are given in Table 1.

