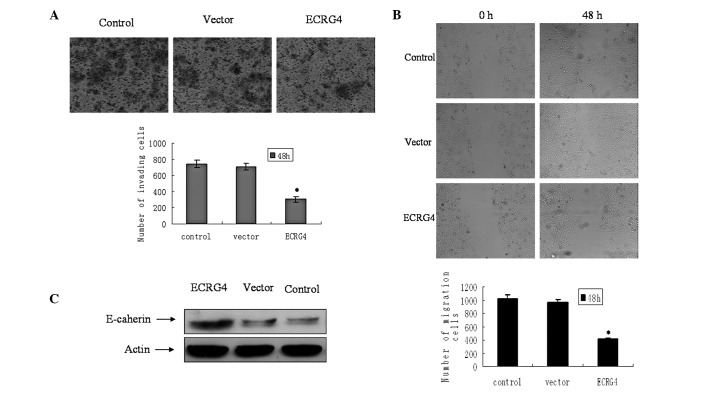
Figure 4.
Effect of ECRG4 on the invasion and migration of M2 cells in vitro. (A) Images were captured using inverted microscopy for the cells which penetrated through the filters to the other side of inserts following various treatments. (B) Images were captured for the wound closure of cells at 0 and 48 h following treatment. Graphs represent the average number of migrating cells from five independent fields. (C) Expression of epithelial marker-E-cadherin in the M2 cells increased significantly following transfection with ECRG4. Error bars represent the standard error of the mean. (*P<0.05).

