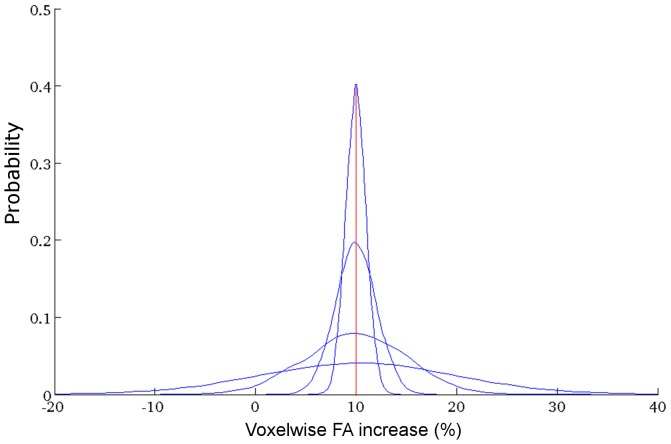
Figure 2. Modeling distributed treatment effects.
Probability density functions of Gaussian distributions with mean effect size of 10% and increasing standard deviation (1%, 2%, 5% and 10%) are shown. Treatment effects were drawn from each distribution according to their probability. Distributions with means of 5%, 15% and 20% were also constructed but are not shown.

