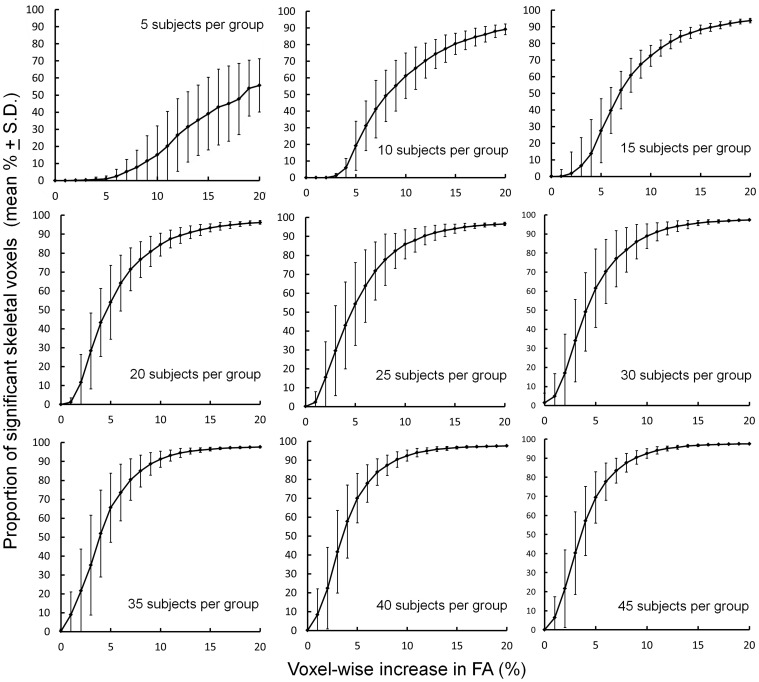
Figure 3. Detecting increasing simulated differences in FA between ‘treated’ and ‘untreated’ groups of increasing size using TBSS.
Plots show the mean proportion of voxels across the mean FA skeleton where a significant difference (FWE-corrected, p<0.05) between ‘treated’ and ‘untreated’ groups could be detected.

