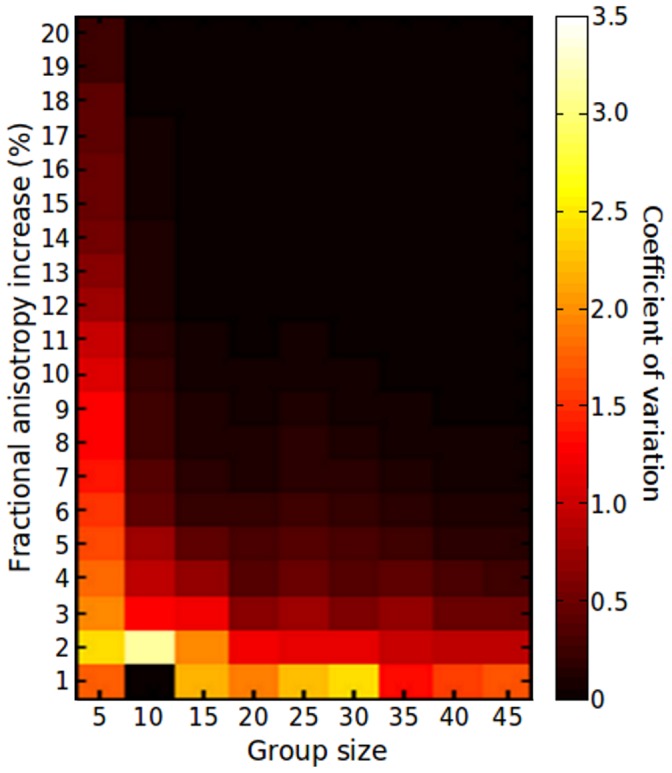
Figure 4. Variation in the detection of group differences between ‘treated’ and ‘untreated’ FA maps.

The coefficient of variation calculated across 10 group permutations is shown in order to demonstrate the variance in the number of significant voxels detected by TBSS for each group size and treatment level.
