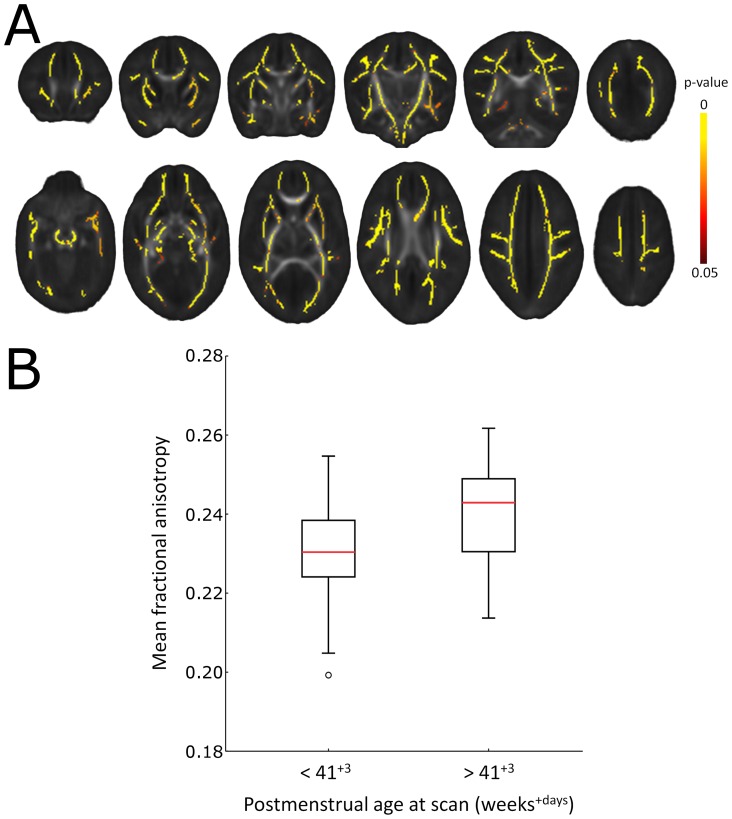
Figure 6. Global increases in FA according to postmenstrual age at scan.
Significantly increased FA (yellow regions; p<0.05, FWE-corrected) in infants scanned at more that 41+3 days postmenstrual age (n = 45) compared to those scanned before then (n = 45) (A). FA values were extracted from across the whole TBSS skeleton and are plotted in B.

