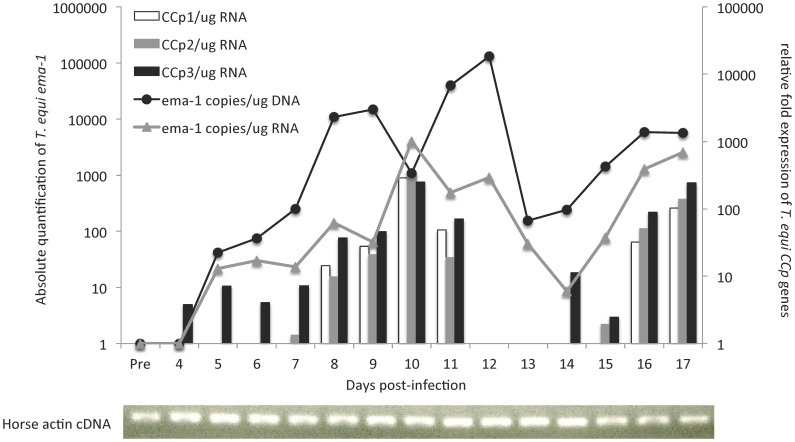
Figure 6. Expression of CCp1-3 during acute T. equi infection.
Relative fold expression of CCp1-3 transcripts in horse peripheral blood during acute T. equi infection is shown in the right y-axis. Absolute quantification of T. equi emai-1 DNA (black line) and cDNA (grey line) is shown in the left y-axis. CCp gene expression was normalized to the total amount of RNA used to generate the cDNA and the transcription level was calculated as a relative expression using the formula: Relative expression (sample) = 2 [Cq (control) – Cq (sample)], where the control is the highest Cq value for a given gene of interest. To confirm the presence of amplifiable cDNA in all tested samples a standard PCR for horse actin was performed.

