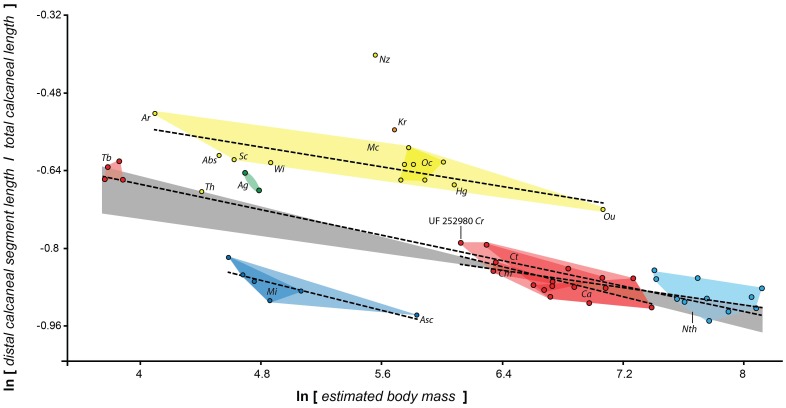
Figure 4. Plotting early fossil forms reveals allometric scaling within and between certain clades.
Different interecepts but similar slopes of scaling of distal calcaneal elongation index to body mass (as reconstructed from cuboid facet area) characterize different groups of early primates. There is a low- (based on Asiadapinae), intermediate- (based on all or subsets of the following taxa: Cantius, Notharctus, Smilodectes and Teilhardina) and high-elongation line (based on Omomyinae: see Table 2); see also Fig. 3B. The intermediate elongation line appears to be primitive, as the non-primate taxa plotting near the low line (some scandentians and plesiadapiforms) actually exhibit a non-significant relationship between mass and elongation. Dashed lines represent ordinary least squares lines for different groups. Adapiforms are represented by a line describing Cantius species only and one representing all notharctids. The gray area represents the space in between the mean for the two lines. Polygons: Red, Cantius and Teilhardina; Light blue, Notharctus; Dark blue, asiadapines; Yellow, Omomyines; Solid yellow, Omomys; Green, Anchomomys. Th, Tetonius homunculus. See Figure 3 caption for taxon abbreviations.

