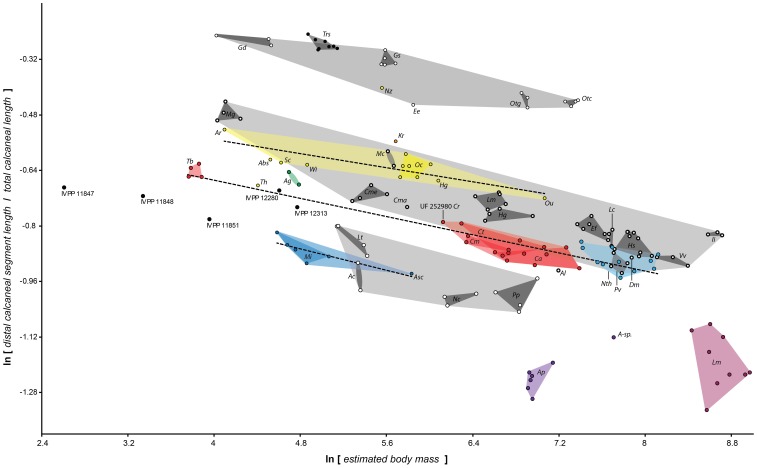
Figure 5. Plot of fossils with extant forms imposed shows similar allometric scaling relationships characterize in living taxa.
To better understand the phenetic associations of the fossils and to help consider the functional implications of their proportions, we plot them with extant taxa. Each data point represents an individual. Dark gray polygons represent species groups. Light gray polygons bound different extant prosimian radiations: Upper polygon, Galagidae; middle polygon, lemuriformes; lower polygon, Lorisidae. (see Figures 2 and 3 for taxon abbreviations). “IVPP” specimens are eosimiids from Shanguang fissure fills with taxon identifications given in Gebo et al. (2000).

