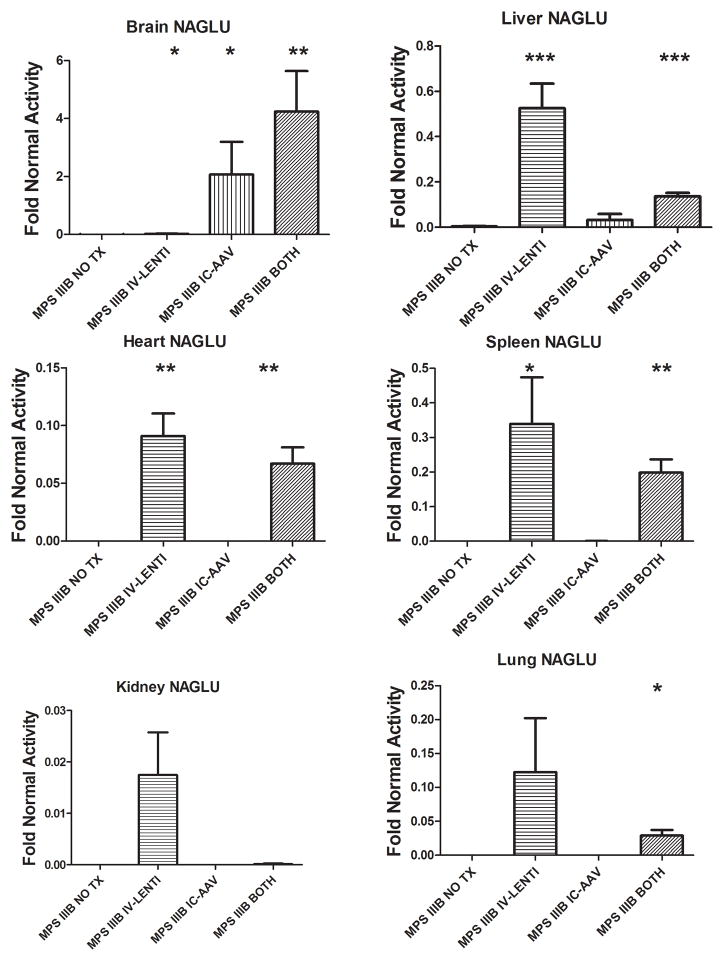
Figure 1.
NAGLU activity was measured in Brain, Liver, Heart, Spleen, Kidney, and Lung from untreated and treated MPS IIIB mice. Mean activity levels +SEM for each group relative to the Normal NO TX group are depicted in the graphs. NO TX, no treatment; IV-LENTI, intravenous lentiviral NAGLU vector; IC-AAV, intracranial adeno-associated viral NAGLU vector; BOTH, both IV-LENTI and IC-AAV treatments. * indicates p<0.05 **indicates p<0.01, *** indicates p<0.001 compared to MPS IIIB NO TX group

