
Figure 8.
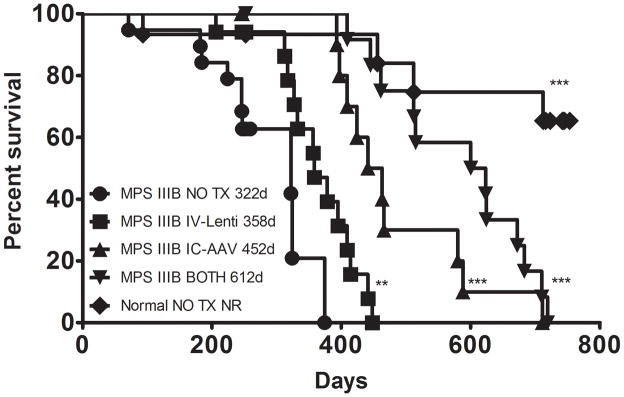
Survival. All treated mice were analyzed for median survival by Kaplan-Meier analysis and plots are shown. All treated groups had significantly improved survival compared to MPS IIIB NO TX. MPS IIIB BOTH is significantly longer than IC-AAV (p<0.05) and IV-LENTI (p<0.001). There is no difference between Normal NO TX and Normal BOTH groups so the latter is not shown for figure clarity. (** p<0.01, *** p<0.001 compared to MPS IIIB NO TX group)