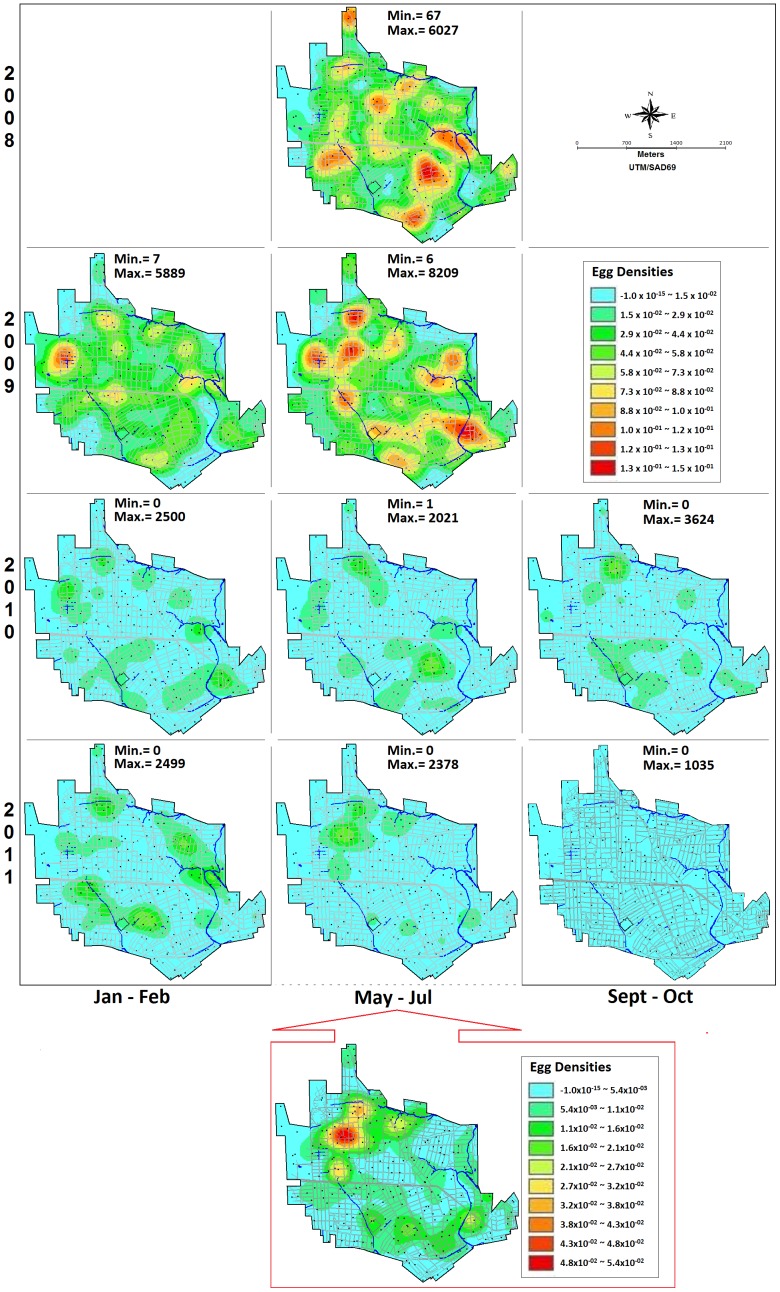
Figure 6. Kernel smoothed egg distribution in Santa Cruz do Capibaribe-PE, Brasil, 2008 to 2011.
Maps are based on eggs laid in 262 sentinel-ovitraps during low and high egg density seasons, before (May/2008 to Sept/2009) and during (Oct/2009 to Oct/2011) integrated control measures including mass-suppression of eggs using 5700 control-ovitraps, and larvivorous fishes added to around 7 thousand cisterns. The same scale was used for all compared kernel maps. For each survey, a self-scale kernel map was also constructed to highlight hotspots, as that shown on the bottom of the middle column, for July 2011.

