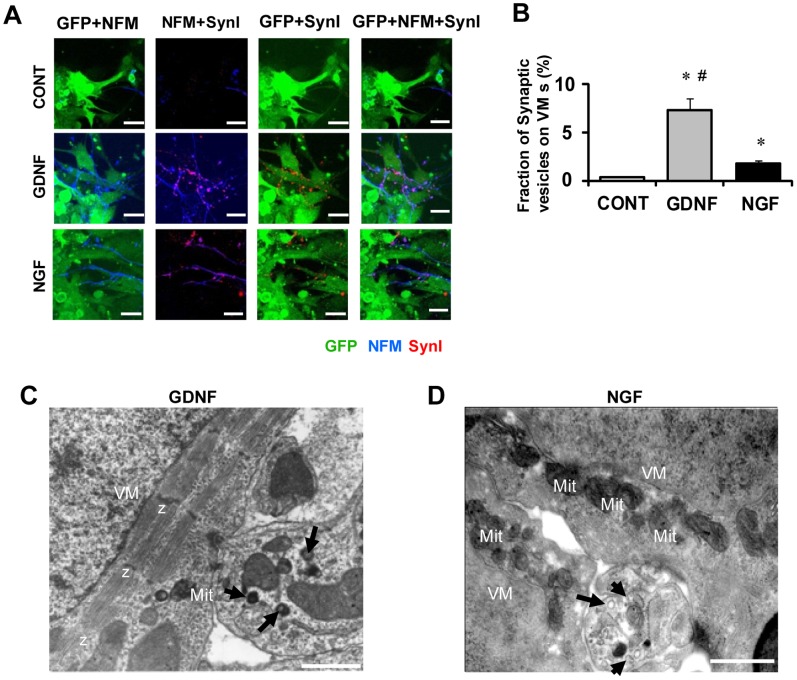
Figure 2. Synapse formation between cardiac cells and sympathetic neurons and ultrastructure of junctions between VMs and SNs.
Proximity co-cultures of GFP-expressing VMs/SN were immunolabeled for neurofilament-M (NFM, blue) and synapsin I (SynI, red) to visualize synapse formation between SNs and VMs. A) Representative fluorescence images of co-cultures treated with vehicle only used as controls (CONT, top), co-cultures treated with GDNF 10 ng/ml for 5 days (middle), and treated with NGF 50 ng/ml for 5 days (bottom). Pictures from left to right are labeled for GFP+NFM, NFM+SynI, GFP+SynI, and GFP+NFM+SynI, respectively. The synaptic vesicles are clustered abundantly on the axons adjacent to VMs in the co-culture treated with GDNF or NGF. Bars indicate 20 µm. B) The fraction of synaptic vesicles (SynI-positive area) on VMs (GFP-positive area). Values are means±SD of 5 co-cultures in each group. *Significantly different from control at p<0.05. #Significantly different from co-cultures treated with NGF at p<0.05 C, D) Images were obtained by transmission electronmicroscopy in proximity co-cultures treated for 5 days either with GDNF (10 ng/ml) (C) or NGF (50 ng/ml) (D). Nerve terminals (NT) contain granular vesicles (arrows), multi-vesicular bodies (arrow heads). These terminals closely appose to the plasma membrane of the VMs(*).Mitochondria (Mit) and myofibrils (Mf) are abundant in the cytoplasm of the VMs. Z: Z-lines. Bars indicate 500 nm.

