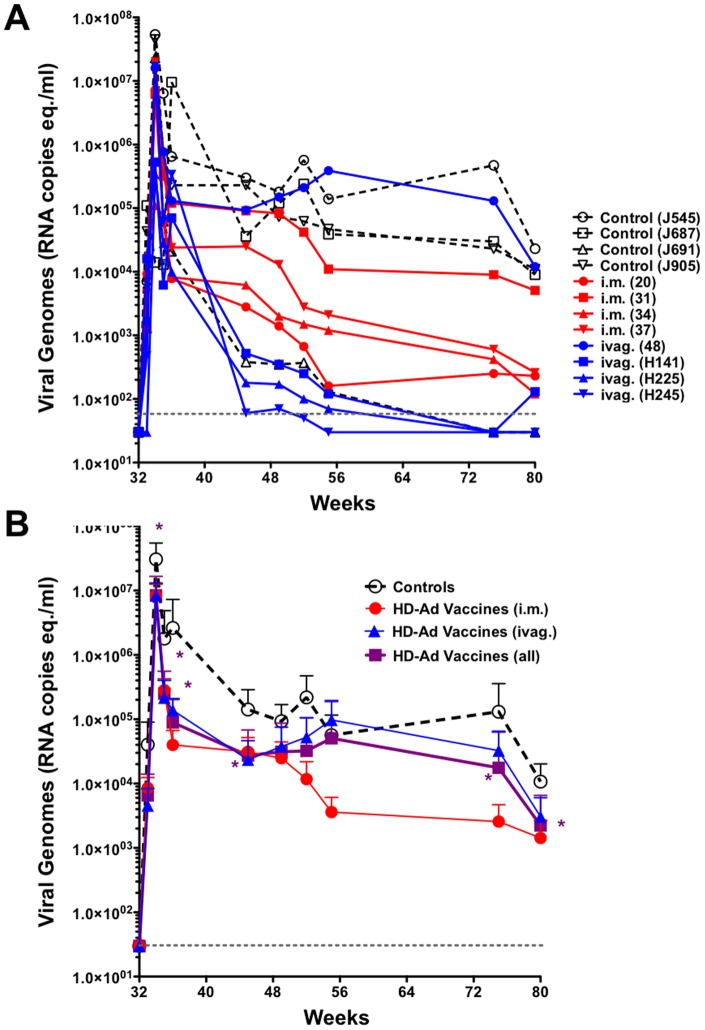
Figure 6. SHIV Viremia After Rectal Challenge.
A) SHIV viral genomes were quantitated from plasma at the indicated times after challenge for each animal. The reported minimal detection for this assay of 30 meq./ml is indicated by a dashed gray line. B) Comparison of mean SHIV viral loads for controls, i.m. vaccinated, ivag. vaccinated, and the combined mean for all vaccinated animals. Asterisks indicate time points at which p<0.05 for controls as compared to combined vaccinated animals by T test. I.m. and ivag. only groups did not reach this p value.

