
Figure 1.
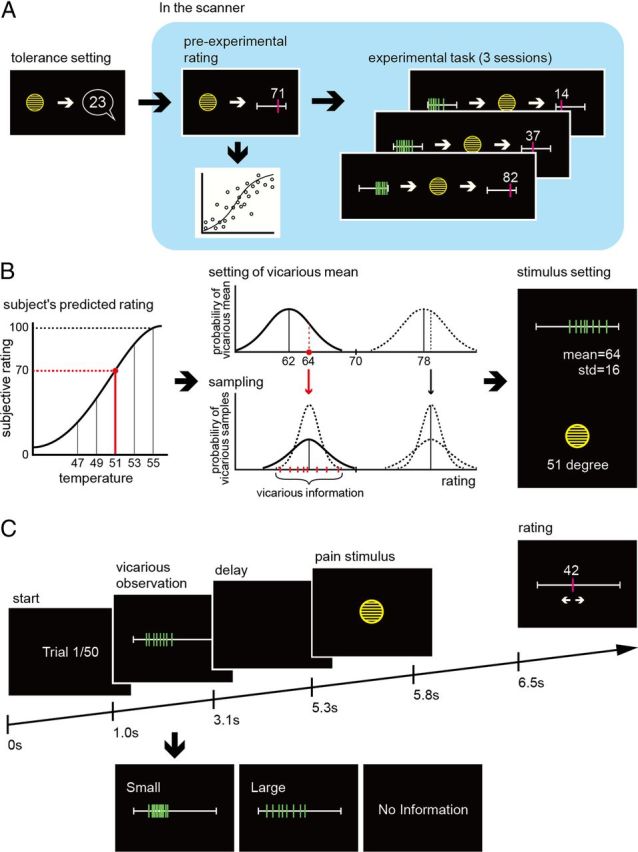
Experimental design. A, The sequence of events was as follows. First, we performed a simple ramped pain tolerance procedure outside the scanner, to determine the upper limit of temperature to be used subsequently. Next, within the scanner, we performed a pre-experimental stimulus rating procedure using a random sequence of temperatures, with no vicarious information. We estimated the subject's stimulus (temperature)–response (pain rating) function by statistical fitting from rating data in the pre-experimental task (as shown schematically). Finally, we performed three experimental sessions, with vicarious information preceding the majority of pain stimuli. B, This example illustrates how the vicarious information was generated. The exemplar trial is with an intermediate intensity stimulus − 51 degrees. Because we have estimated the temperature-pain rating function (as in A), we can predict that the subject would rate this temperature as a 70/100 on the pain scale, if it was presented with no vicarious information. On this trial, we decide to give vicarious information that is below the subjects predicted rating, but with large uncertainty. On average (i.e., over all such trials) we want the mean of the vicarious information to be 8 VAS points below the subject, but the deviation on each trials is sampled from a Gaussian distribution to induce greater variability. In this example, we sampled a value of 6 points below the subject i.e., pain rating of 64/100. This is the mean of the vicarious information. The SD for a high uncertainty trial is pre-set to be 16 points. These statistics are used to sample eight fictitious people, shown as the green bars in the far right of the panel. The dotted lines show in the middle panel show putative distributions for low uncertainty vicarious information, as well as for high and low uncertainty ratings above the subjects rating. C, Trial structure. At the beginning of each trial, subjects viewed a pain ratings bar with eight marks corresponding to the ratings of eight fictitious people (we show both a high and low uncertainty example here). After 2.1 s, the bar disappeared, and after a further 2.2 s, subjects experience a short-lasting heat stimulus via the thermode. They then rated their own intensity judgment on the ratings bar, before proceeding to the next trial. Occasionally trials with no vicarious information were provided, to update the estimated stimulus–response function.