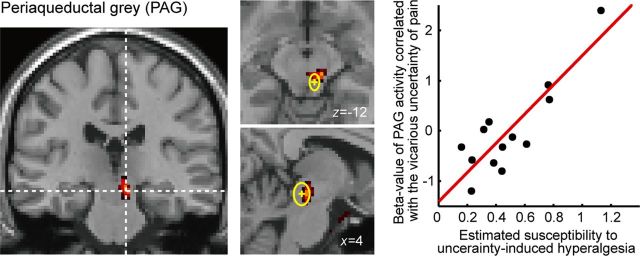
Figure 5.
The right PAG (x = 8, y = −24, z = −12; k = 24) activity correlated with responses to the uncertainty of pain intensity at pain delivery time, using the individual intensity of hyperalgesic effect as a covariate. The anatomical position of PAG evaluated from previous studies is shown in the middle panels: the mean and the SD of the peak voxels reported as the PAG activity (x = 4 ± 3, y = −29 ± 5, z = −12 ± 7) (Linnman et al., 2012) are displayed as the yellow cross and the circle, respectively. As with activity in the anterior insula in Figure 3B, β estimates extend both above and below the zero parameter estimate line.

