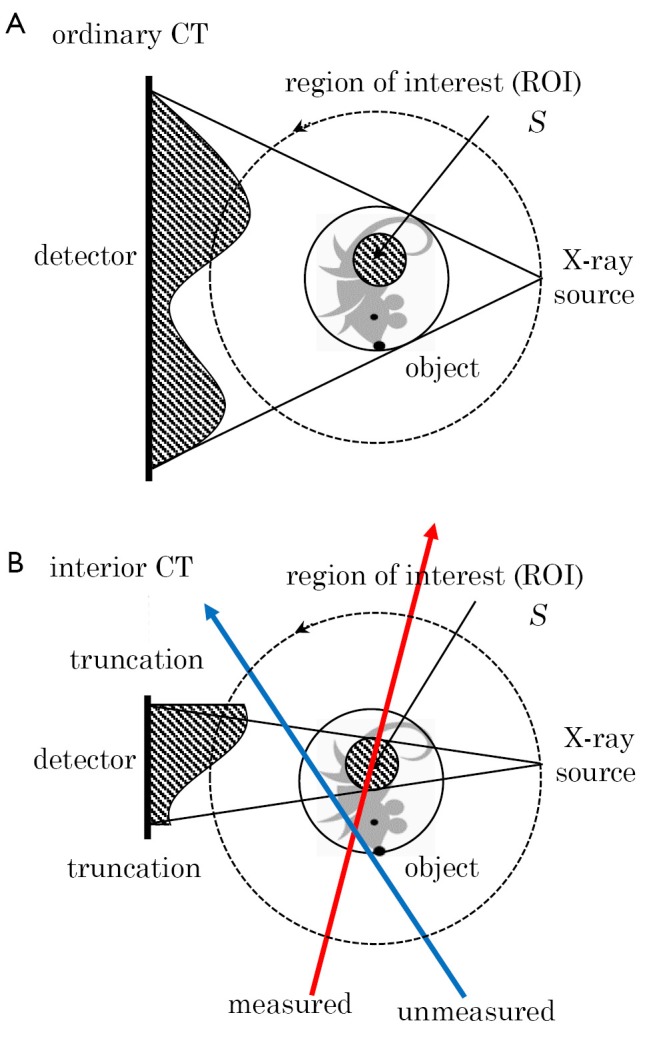
Figure 7.

Schematic illustration of data acquisition in (A) the ordinary CT and (B) the interior CT. In the interior CT, an X-ray beam from each source position covers only a small ROI containing a target of diagnosis. For example, projection data corresponding to the red line is measured, but projection data corresponding to the blue line is unmeasured
