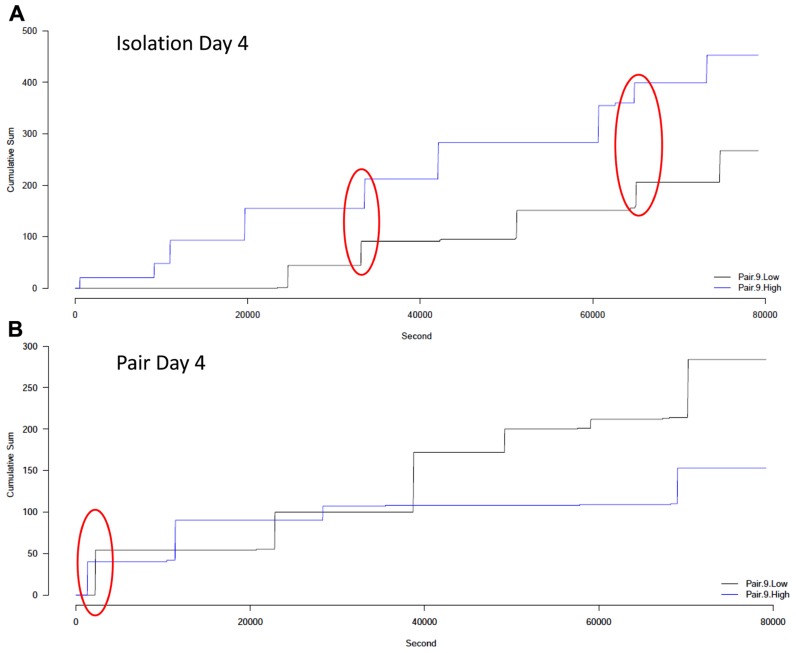
FIGURE 6.
Cumulative number of licks of ethanol over 22 h for an example pair. (A) The drinking patterns for subjects in a pair on the last day of isolation. (B) The drinking patterns for subjects in the same pair on the last day of pair housing. The high drinker is shown in blue and the low drinker is shown in black. Each “step up” in the graph indicates a bout of drinking while each horizontal line indicates a time when no drinking occurred. The red circle indicates bouts that occurred close together in time, within the applied threshold.

