Figure 2.

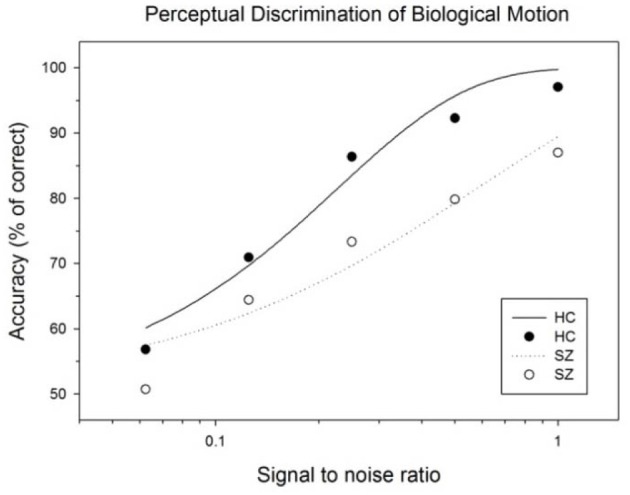
Subject performances as a function of signal to noise ratio of BM stimulus. The curves represent the fits of data by a psychometric function (Weibull equation) for each subject group.

Subject performances as a function of signal to noise ratio of BM stimulus. The curves represent the fits of data by a psychometric function (Weibull equation) for each subject group.