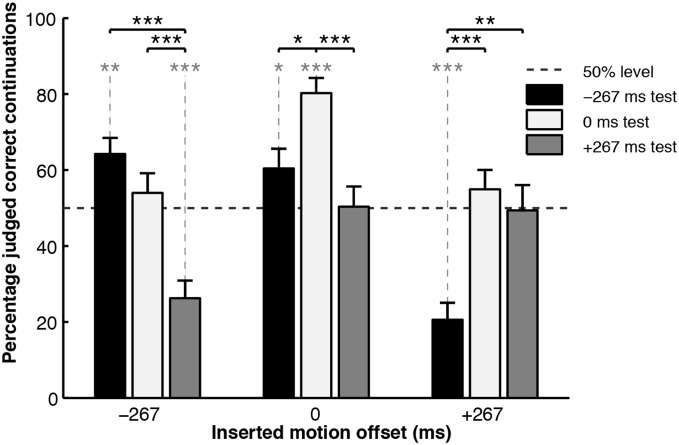
Figure 4.
Percentage correct judgments for the “inserted motion” experiment. Black asterisks connected with solid lines indicate significance levels of between-condition t-test comparisons. Asterisks in gray connected with dotted lines indicate significance levels of one-sample t-test comparisons to chance performance (50%), *p < 0.05, **p < 0.01, ***p < 0.001. Figure reproduced from Parkinson et al. (2012, p. 428). Copyright © Springer Science+Business Media. Reproduced with permission.

