
Figure 6.
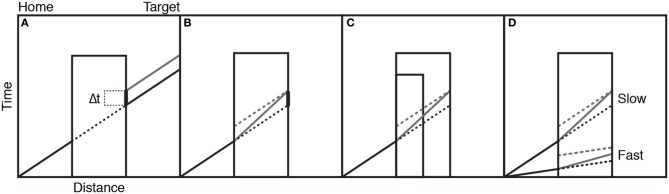
Panel (A) shows the actual movement of an object behind the occluder (black lines) and the action simulation (gray line) illustrating lag error. Panel (B) shows two sources of the lag error: intercept (dotted gray) and slope (solid gray) lines. Panel (C) shows the different predictions of the two sources of lag error when occluder duration changes. Panel (D) shows the different predictions of the two sources of lag error when motion speed changes. See text for detailed explanations. Figure adapted from Prinz and Rapinett (2008) (p. 226). Copyright by IOS Press. Adapted with permission.