
Figure 7.
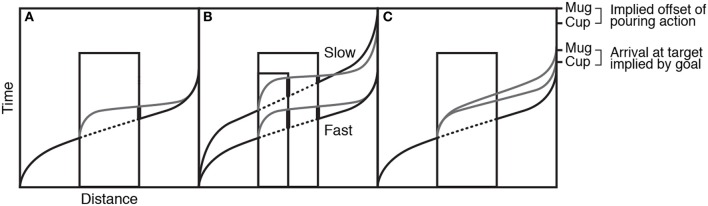
Panel (A) shows the velocity profile of the action as it accelerates from the start and decelerates at the target (black solid line) with the occluded portion dotted. The regenerated action simulation is shown in gray. Panel (B) shows how this regenerated simulation hypothesis provides different predictions when occluder duration and action speed change. Panel (C) shows how action simulations might be affected by the implied goal of the action. Figure adapted from Prinz and Rapinett (2008) (p. 226). Copyright by IOS Press. Adapted with permission.