
Figure 8.
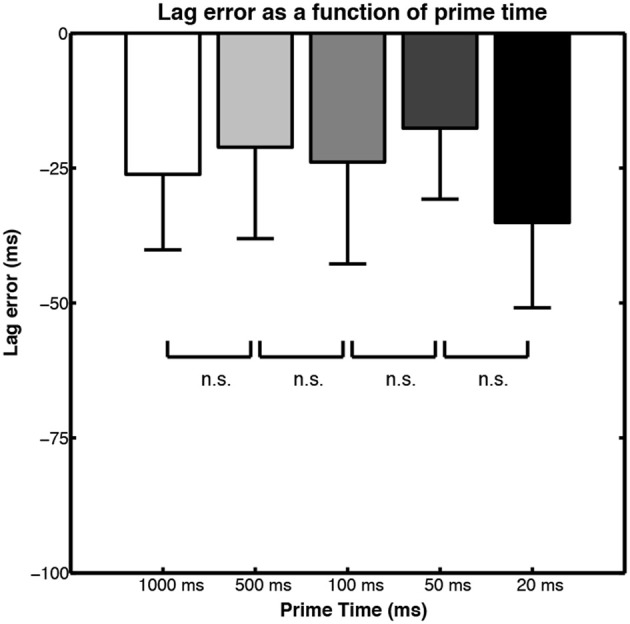
Bar graphs of lag error in action simulation motion judgments when different durations of motion are shown prior to occlusion. Figure adapted from Parkinson et al. (2012, p. 426). Copyright © Springer Science + Business Media. Adapted with permission.