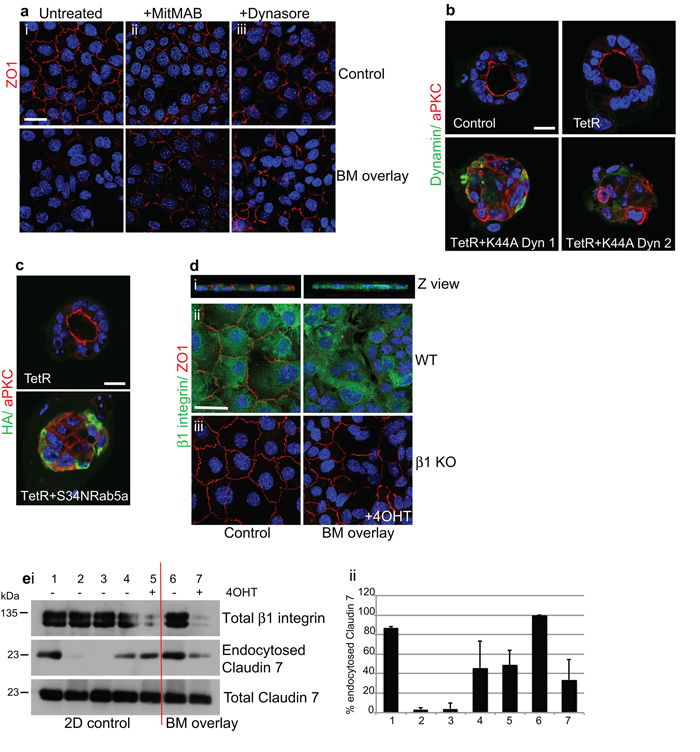
Figure 7. β1-integrins orient polarity via an endocytic mechanism.
(a) Confocal images of monolayer ICR MECs (i) untreated or pre-treated for 1 h with (ii) MitMAB or (iii) dynasore prior to 6 h BM-overlay. Blocking dynamin prevented ZO1-internalization by the BM-overlay. Note that dynamin inhibition by itself slightly reduced apical tight junctions compared to untreated controls, possibly as a result of decreased vesicle budding from the Golgi 53, but no further loss occurred in response to the BM-overlay. Bar: 8μm.
(b) MECs infected with adenoviruses expressing TetR alone, TetR + K44A-dynamin1 or TetR + K44A-dynamin2, then cultured in 3D on BM-matrix. DN-dynamin prevented relocation of aPKC to the internal luminal surface and polarization of acini. Note that these acini resemble day 1 of the developmental time course (cf Fig. 3a) Bar: 10μm.
(c) MECs infected with adenoviruses expressing TetR alone, TetR + S34NRab5a and then cultured in 3D on BM-matrix. DN-Rab5a prevented relocation of aPKC to the internal luminal surface and polarization of acini. Bar: 10μm.
(d) Left panels: confluent monolayers of WT MECs displayed apical tight junctions (ZO1) and basolateral β1-integrin. (i) Z-section (ii, iii) confocal view. Right panels: BM-overlay induced ZO1 disruption in WT but not β1-KO MECs. Confocal plan views were merged from the top and middle to show both ZO1 and nuclei. Bar: 8μm
(e) Surface biotinylation of cells followed by 6 h BM-overlay then blotting of endocytosed Claudin 7. i) (1-5) Monolayer controls, (6,7) BM-overlay. (1,2) Efficiency of biotin stripping from the surface at 4°C: (1) unstripped, and (2) stripped monolayers. (3-7) To induce endocytosis, cells were switched to 37°C after biotin labelling: (3) no biotin, (4) monolayer, (5) monolayer +4OHT, (6) BM-overlay, (7) BM-overlay +4OHT. ii) ImageJ64 quantification of endocytosed Claudin7 immunoblots. Histogram represents mean values +/− s.e.m for error bars of n=3 experiments. Note that BM-overlay increased Claudin 7 endocytosis (cf 4,6), which was prevented by β1-integrin deletion (cf 6,7).
See also Supplementary Figs 7, 8.

