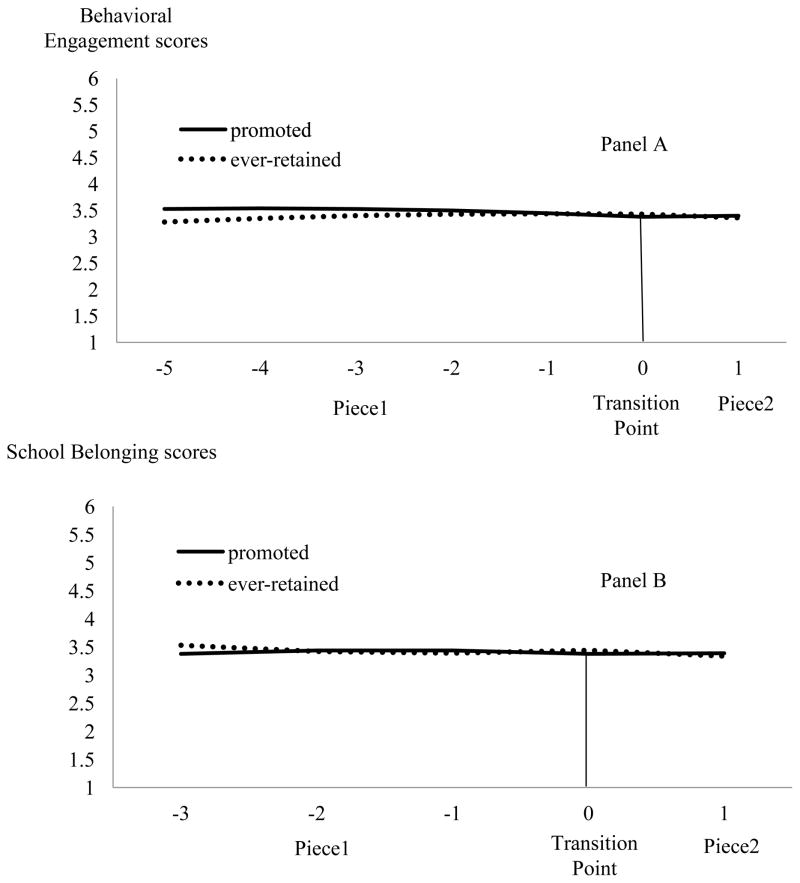
Figure 2.
Estimated growth trajectories of teacher-rated behavioral engagement scores (Panel A) and student reported school belonging scores (Panel B) for ever-retained and promoted students in elementary grades. The transition point (0 on the x axis) marks the transition from elementary school level to middle school level.. Piece1 represents the developmental growth before the transition to middle school (from -5 to -1 and from -3 to -1 for Panel A and Panel B, respectively). Piece2 represents the developmental growth after the transition to middle school (from 0 to 1).

