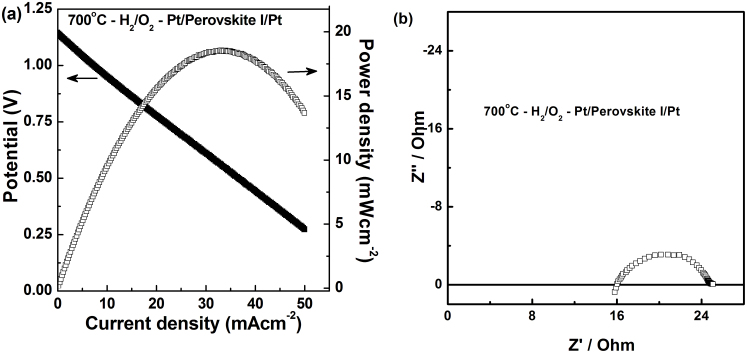
Figure 4. Polarization studies on Ba0.5Sr0.5Ce0.6Zr0.2Gd0.1Y0.1O3−δ (Perovskite I).
Fuel cell polarization plot obtained using Pt paste as the cathode and anode and Perovskite I as electrolyte under humidified H2 and dry O2 as the fuel and oxidant at 700°C and (b) Impedance Nyquist plot obtained for this cell under above mentioned conditions in the frequency range of 1 MHz to 0.1 Hz. The high resistance observed in the Nyquist plot is due to thicker electrolyte (~3 mm).

