
Figure 1.
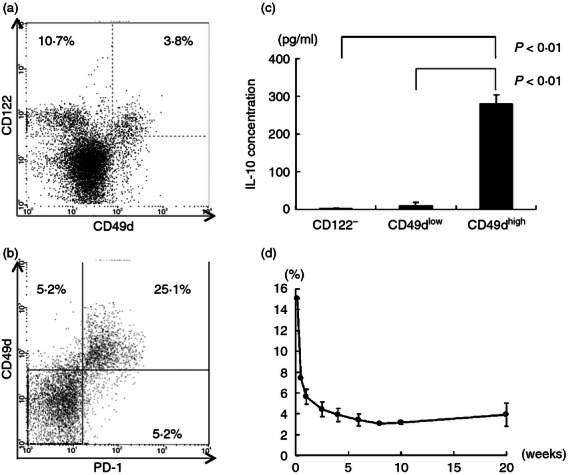
Characteristics of CD49dhigh and CD49dlow cells in CD8+ CD122+ cells. (a) FACS analysis of spleen cells obtained from 6-week-old female C57BL/6 mice. Cells were stained with anti-CD8a, anti-CD122 and anti-CD49d antibodies. Expression pattern of CD49d and CD122 in CD8+ cells is shown. A representative result among more than 10 experiments is presented. (b) Expression profile of programmed death 1 (PD-1) and CD49d in the CD8+ CD122+ population. Spleen cells were stained with anti-CD8a, anti-CD122, anti-CD49d and anti-PD-1 antibodies. Only CD8+ CD122+ cells are shown in the plot. (c) CD8+ CD122−, CD8+ CD122+ CD49dlow and CD8+ CD122+ CD49dhigh cells were collected from spleen cells using a cell sorter and 105 cells per well were stimulated with plate-bound anti-CD3 antibody in vitro for 48 hr. Interleukin 10 (IL-10) concentration in the culture supernatant was measured by ELISA. Results are shown as mean ± standard deviation (SD). This result is representative of more than five independent experiments performed. (d) Percentage of CD8+ CD122+ CD49dhigh cells in mice of various ages. Spleen cells obtained from mice of the indicated age were analysed. In each experiment, more than 105 cells obtained from a single mouse were analysed in a single experiment except when cells were collected from two to four mice in the case of neonates. Percentages of CD8+ CD122+ CD49dhigh cells in CD8+ populations are shown as mean ± SD. Results are obtained from at least three independent experiments.