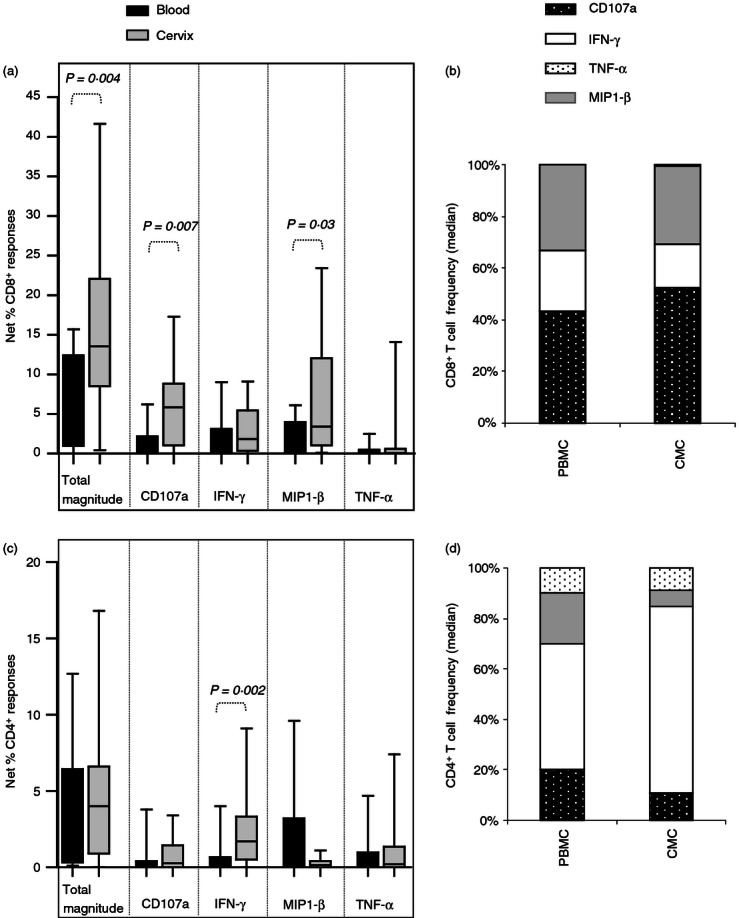
Figure 2.

Comparison between female genital tract and blood CD8+ and CD4+ T-cell responses to HIV Gag in T-cell lines expanded with Dynal beads from HIV-infected women. (a) Total and individual frequencies of CD8+ responses detected in blood (black bars) and cervix (grey bars) from Dynal bead expanded lines. (b) Cumulative frequencies of CD8+ CD107a (dotted black bar), interferon-γ (IFN-γ; open bar bar), macrophage inflammatory protein-1β (MIP-1β; grey bar) and tumour necrosis factor-α (TNF-α; dotted bar) T-cell responses in peripheral blood mononuclear cells (PBMC) and cervix (CMC). (c) Total and individual frequencies of CD4+ responses detected in blood (black bars) and cervix (grey bars) from Dynal bead expanded lines. (d) Cumulative frequencies of CD4+ CD107a (dotted black bar), IFN-γ (open bar bar), MIP-1β (grey bar) and TNF-α (dotted bar) T-cell responses in PBMC and CMC. Each box and whisker plot shows the median (central line), interquartile range (IQR; outer lines of box) and 10–90% range (error bars) of 16 HIV-infected individuals. Wilcoxon Rank Test was used to compare blood and cervical responses and a P < 0·05 indicates a significant difference.
