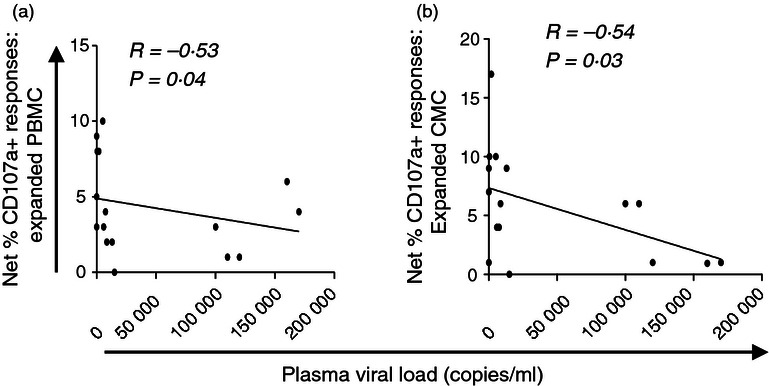
Figure 3.

Relationship between HIV plasma viral load and blood or cervical CD8+ T-cell CD107a responses to Gag in expanded T-cell lines. Relationship between expanded blood (a) and cervical (b) CD8+ T-cell responses (shown as percentages of cells producing CD107a) and plasma viral load. Spearman Rank Test was applied to test correlations and P-values < 0·05 were considered significant. Spearman Rho scores are shown on each plot.
