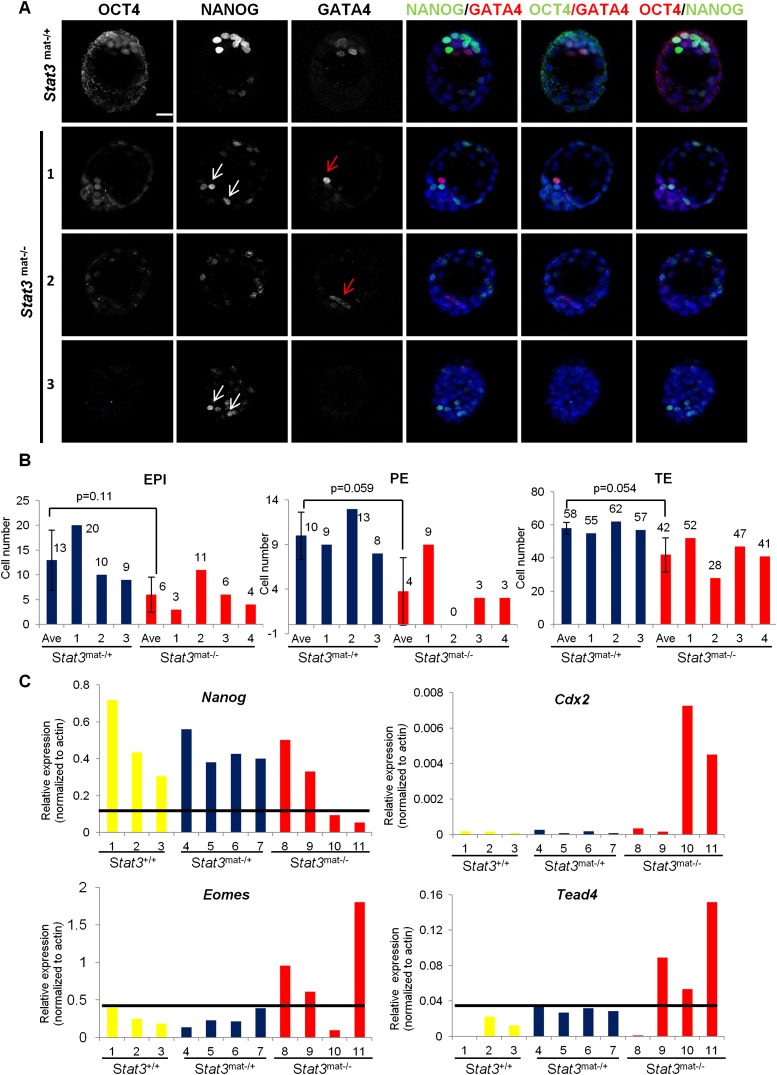
Figure 4.
Maternal and paternal Stat3 knockout, expanded blastocysts exhibit a variable abnormal phenotype. (A) Immunodetection of OCT4, NANOG, and GATA4 in Stat3mat−/+ and Stat3mat−/− expanded blastocysts. Embryo 1 has NANOG-positive (white arrows) and GATA4-positive (red arrow) cells in ICM. Embryo 2 has GATA4-positive cells (red arrow) but no OCT4- and NANOG-positive cells in the ICM. Embryo 3 has Nanog-positive cells in either the ICM or TE (white arrow) and no OCT4- and GATA4-positive cells. Bar, 20 μm. (B) The bar graphs show the average and individual cell number in ICM, PE, and TE lineages in the Stat3mat−/+ (blue bars) and Stat3mat−/− (red bars) expanded blastocysts. The EPI, PE, and TE cells are identified as NANOG+/CDX2−, GATA4+/CDX2−, and CDX2+ cells, respectively. (C) Real-time PCR shows mRNA expression of Nanog, Cdx2, Eomes, and Tead4 in individual ICMs that were isolated by immunosurgery from Stat3+/+ (yellow bars), Stat3mat−/+ (blue bars), and Stat3mat−/− (red bars) early blastocysts.

