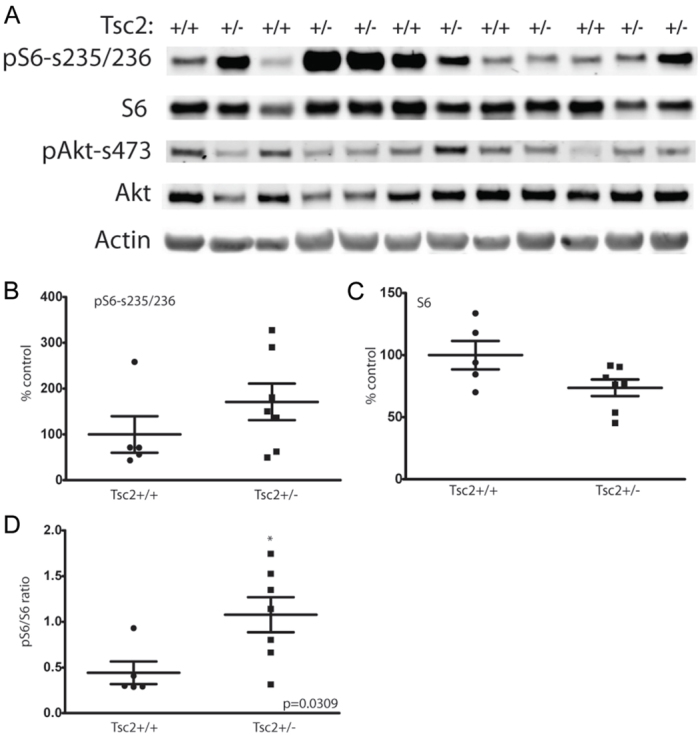
Fig. 3.

Increased mTORC1 signaling in tumors arising from tsc2;p53 compound mutant zebrafish compared with p53zdf1/zdf1 zebrafish. (A) Immunoblotting of a series of abdominal tumors comparing p53zdf1/zdf1 mutant zebrafish (lanes marked Tsc2+/+) and tsc2;p53 compound mutants (lanes marked Tsc2+/−). (B) Quantification of phospho-S6 levels were normalized to actin expression (P=0.25). (C) Quantification of total S6 levels were normalized to actin expression (P=0.06). (D) Increased ratio of normalized phospho-S6 to total S6 levels in tsc2;p53 compound mutant compared with p53zdf1/zdf1 zebrafish; asterisk denotes significance by two-tailed Student’s t-test, P=0.03. n=5 for p53 mutant and n=7 for compound mutant zebrafish, although two tumor samples from tsc2;p53 compound mutant zebrafish (lanes 4,5 and 11,12) were divided in half and processed independently for immunoblotting.
