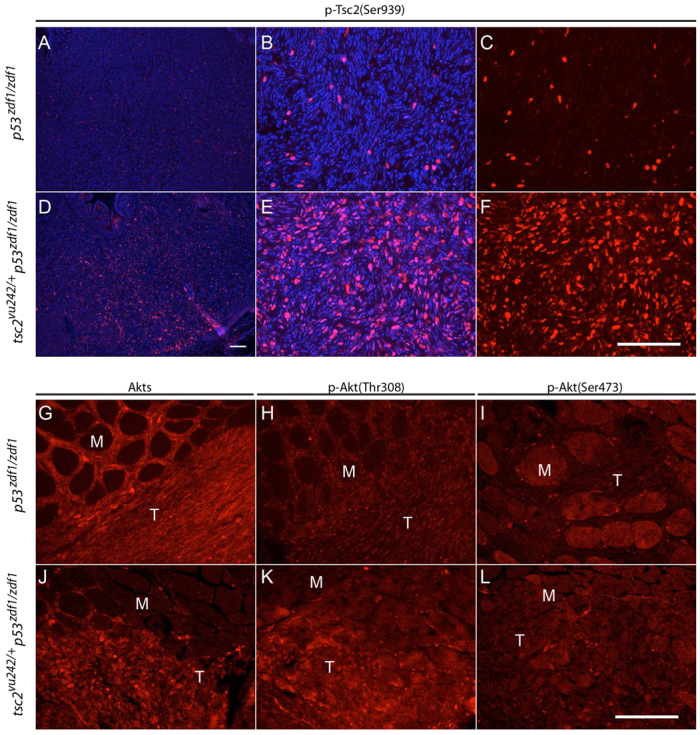
Fig. 4.

AKT activity in p53zdf1/zdf1 and tsc2;p53 compound mutant tumors. (A–F) Phospho-tuberin (p-Tsc2) staining in p53zdf1/zdf1 and tsc2;p53 compound mutant zebrafish. (B,C and E,F) Higher magnification of A and D, respectively. (C,F) Phospho-tuberin (Ser939, red); (B,E) phospho-tuberin (red) merged with DAPI (blue). (G,J) Total Akt immunofluorescence, (H,K) phospho-Akt (Thr308) immunofluorescence and (I,L) phospho-Akt (Ser473) immunofluorescence in p53zdf1/zdf1 (G–I) and tsc2;p53 compound mutant (J–L) zebrafish. M, muscle; T, tumor. Scale bars: 100 μm.
