Figure 2.
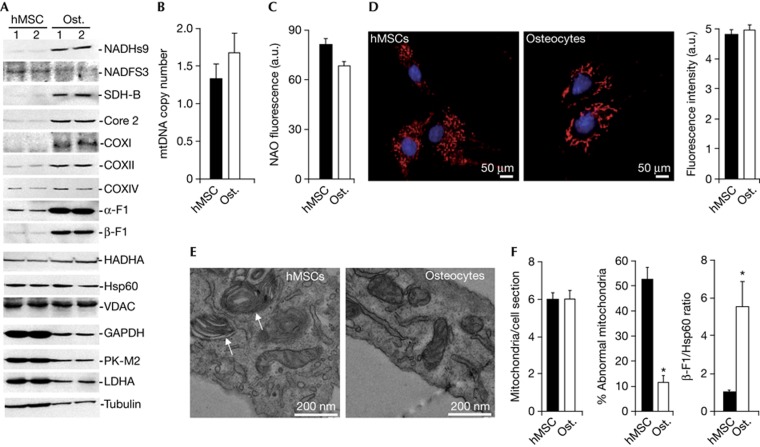
Differentiation of mitochondria upon osteogenic induction. (A) Representative western blots of the expression of mitochondrial proteins (NADHs9, NDUFS3, SDH-B, Core 2, COXI, COXII, COXIV, α-F1-ATPase, β-F1-ATPase, HADHA, Hsp60 and VDAC), glycolytic enzymes (GAPDH, PK-M2 and LDHA) and tubulin in two different preparations of hMSCs and osteocytes. (B) hMSCs and osteocytes were processed for the determination of the relative mtDNA copy number (12S/β-F1-ATPase ratio). Bars represent the mean±s.e.m. of seven independent determinations. (C) The mitochondrial mass was determined by the content of cardiolipin as assessed by NAO fluorescence. Bars are the mean±s.e.m. of six independent determinations. *P<0.05 when compared to hMSCs. (D) Fluorescence microscopy of hMSC and osteocytes stained with MitoTracker Red and Hoechst. Images show a partially fragmented mitochondrial network in hMSCs when compared to the thread-like morphology of mitochondria observed in osteocytes. The histogram shows the quantification of the MitoTracker signal in hMSCs and osteocytes. The results shown are the mean±s.e.m. of 45–60 different cells. (E) Representative electron microscopy images of mitochondria in hMSCs and osteocytes. Onion-like mitochondria (white arrows) are observed in hMSCs. The histograms show the quantification of the number of mitochondria per cell section and the percentage of abnormal organelles in ultrathin sections of hMSCs and osteocytes, respectively. The results shown are the mean±s.e.m. of 45–50 different cells. *P<0.05 when compared to hMSCs. (F) The histogram shows the mean±s.e.m. of the calculated β-F1-ATPase/Hsp60 ratio in hMSCs and osteocytes in four different samples. *P<0.05 when compared to hMSCs. a.u., arbitrary units; COX, cytochrome oxidase; GAPDH, Glyceraldehyde 3-phosphate dehydrogenase; hMSCs, human mesenchymal stem cells; LDH-A, lactate dehydrogenase A; NADHs9, nicotinamide adenine dinucleotide subunit 9; OL, oligomycin; OSR, oligomycin-sensitive respiration; Ost., osteocytes; PK-M2, pyruvate kinase isoform M2.

