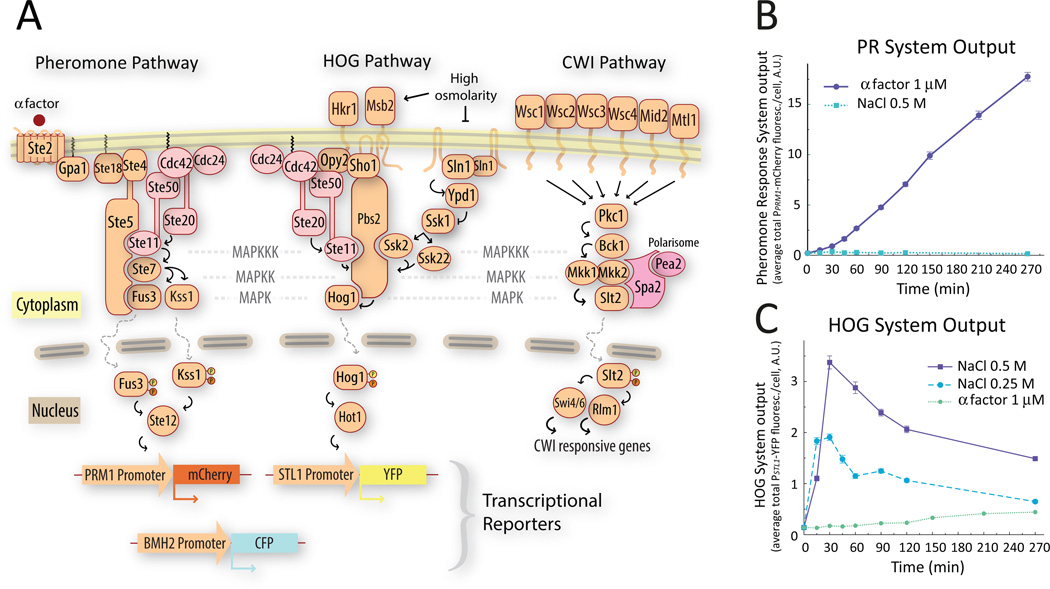
Figure 1. A. Schematic representation of the three MAPK pathways relevant for this study.
Activation of the pheromone response pathway induces the PPRM1-mCherry transcriptional reporter (left). When phosphorylated and activated Hog1 translocates to the nucleus, it associates with transcription factors like Hot1 to drive the expression of the PSTL1-YFP transcriptional reporter (middle). The CWI MAPK pathway (right). B&C. Single stimulus behavior of the transcriptional reporters used in this study. We stimulated exponentially growing wild-type (LD3342, Δbar1 PPRM1-mCherry PSTL1-YFP PBMH2-CFP) cells with α factor (B) or the indicated concentrations of NaCl (C), and collected samples into cycloheximide at the indicated times for imaging and fluorescent protein quantification. Each input activated only one reporter. Addition of NaCl caused an increase in YFP fluorescence followed by a decline to a lower steady state. Data corresponds to the average total mCherry (B) or YFP (C) fluorescence intensity per cell. Error bars represent the standard error of the mean. (n ∼ 700 cells for each data point). Plots show one representative experiment out of three biological replicates.

