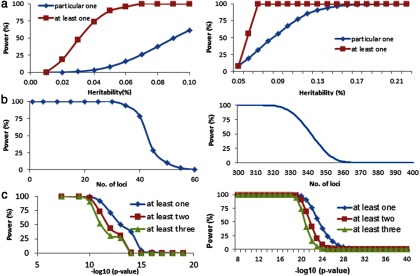
Figure 2.

Power of a meta-analysis in ideally homogeneous populations. The left and right columns show the results for the situations of 1000 and 500 causal SNPs, respectively. A, We simulated several homogeneous GWAS samples (total sample size of 32 961 study subjects) for a meta-analysis. The significance level was set at the genome-wide scale of 5 × 10⁻⁸. Power was estimated on 10 000 simulation replications. For at least 1 case, the x-axis corresponded to the heritability threshold. B, Power of a meta-analysis for identifying at least a specified number of loci. C, Power of a meta-analysis to identify at least 1, 2, or 3 independent SNPs for various significance levels.
