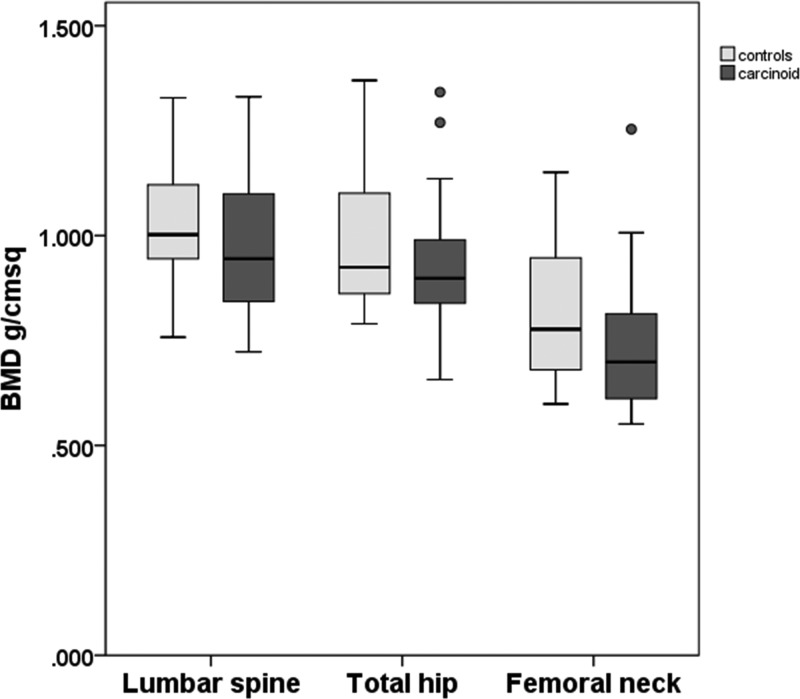
Figure 1.
BMD by DXA. Boxes indicate the 25th and 75th centiles, central lines indicate the median, whiskers indicate the minimum and maximum values that are not outliers, and circles represent outliers. Lumbar spine paired differences were not normally distributed, so values were log transformed for analysis (paired samples t test; no significant differences between controls and carcinoid).

