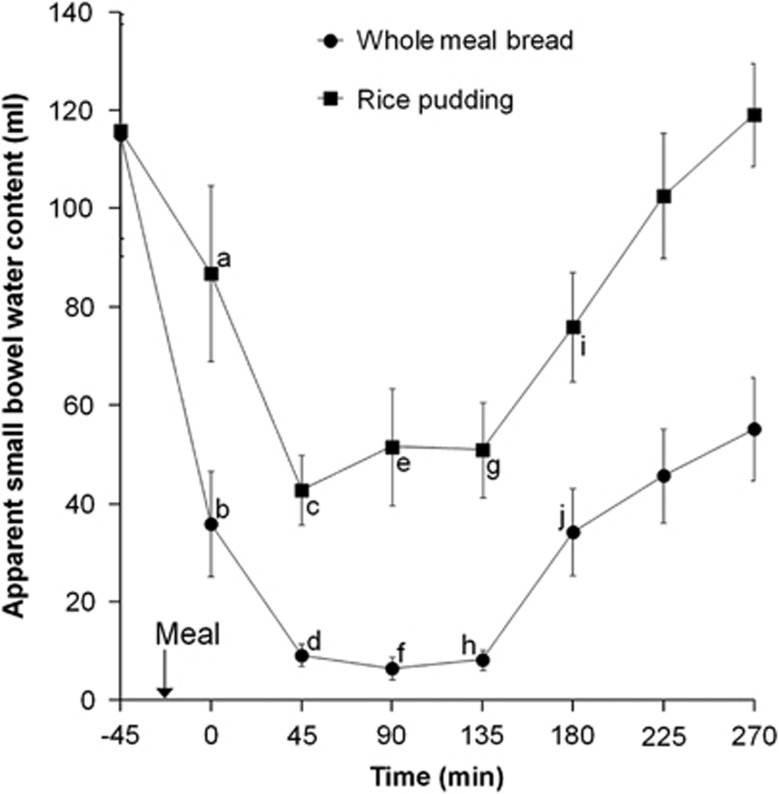
Figure 3.
Plot of the apparent SBWC volumes with time for the healthy volunteers after they consumed the WMB meal and the RP meal. Values are mean±s.e.m., n=12. The arrow on the horizontal axis indicates the meal start time. Within a time point, labelled means without a common letter differ (a vs b and i vs j, P<0.01; c vs d and g vs h, P<0.001; e vs f, P<0.0001; Bonferroni corrected post hoc tests after demonstration of a significant main effect by meal by analysis of variance).

